
Tirzepatide lowers A1c levels within about four weeks of the first injection, while mean weight loss of 15 to 20 percent emerges only after 72 weeks of titrated dosing in clinical cohorts. The distinction between these two timelines matters because tirzepatide binds its targets within hours, yet the clinical endpoints patients care about follow a much slower trajectory governed by dose escalation and steady-state pharmacokinetics.
Pharmacokinetics: Tmax and Half-Life
Tirzepatide reaches peak plasma concentration between 8 and 72 hours after a subcutaneous injection, according to published drug profiles reviewed by Medical News Today. The drug has a half-life of roughly five days. This parameter supports once-weekly dosing and explains why small amounts remain detectable in the body for up to 25 days after the last injection, as GoodRx notes.
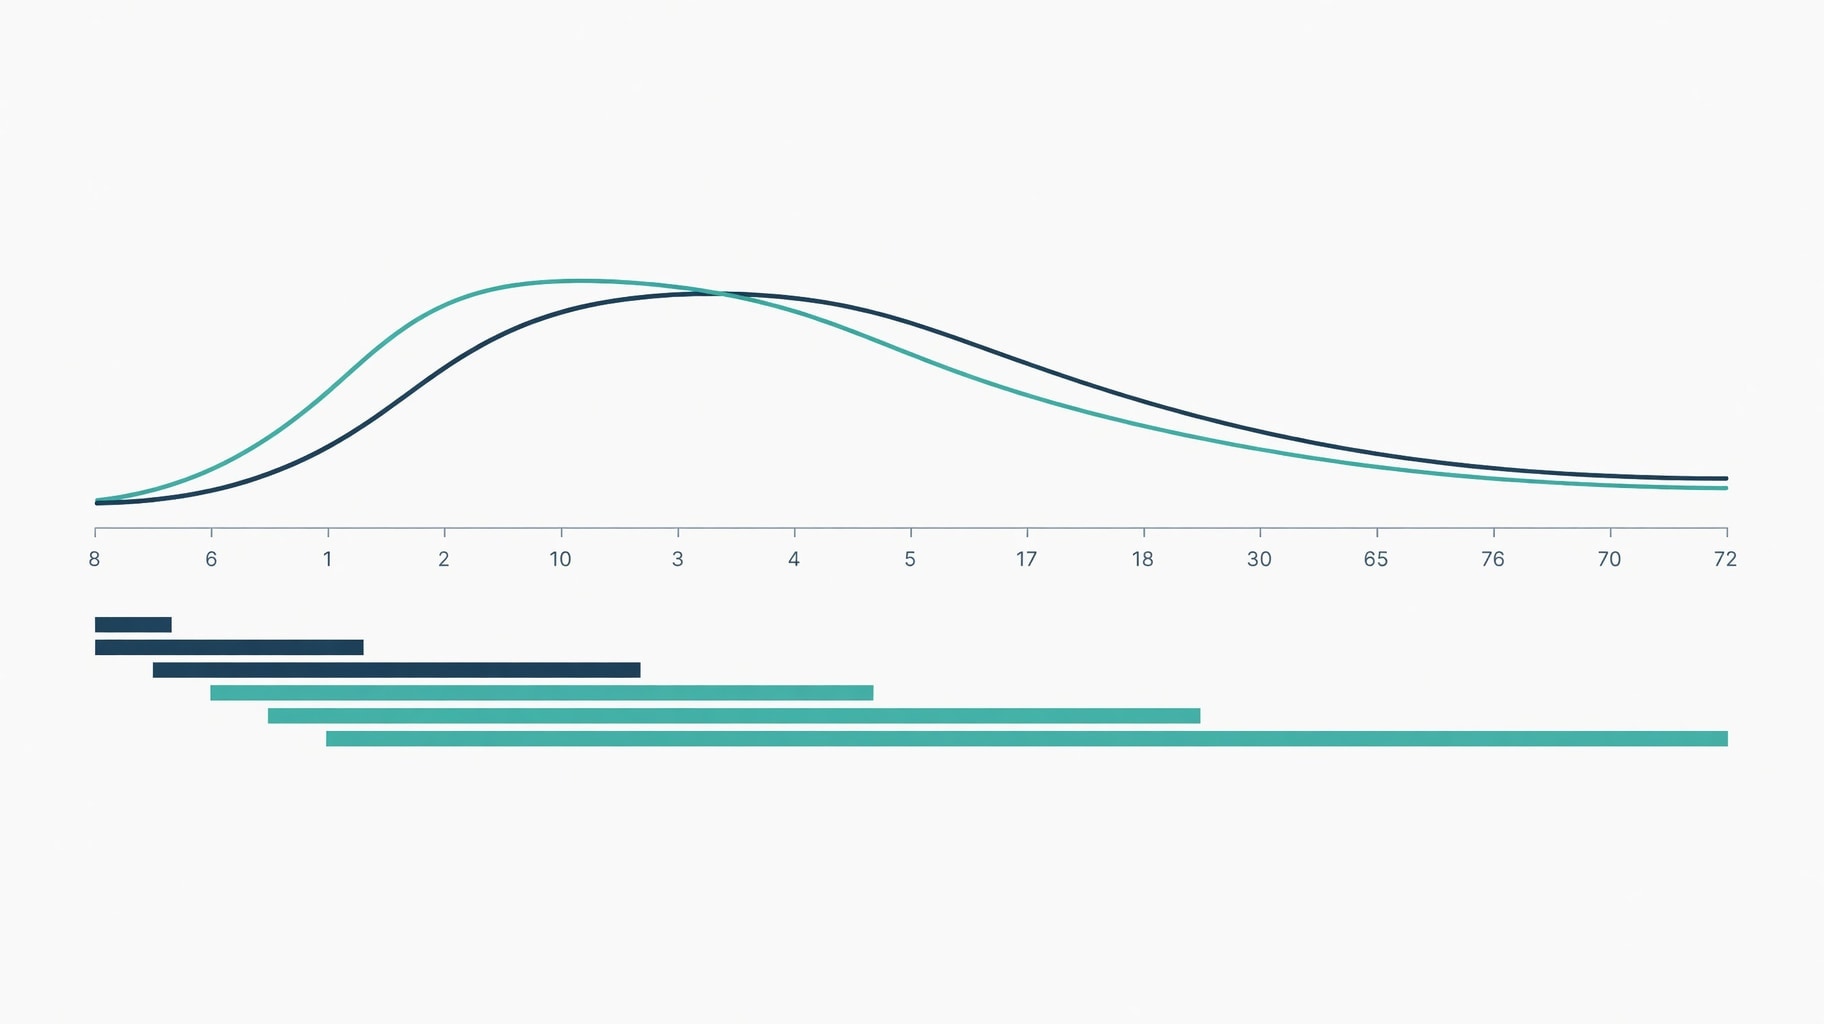
Figure 1: Tirzepatide pharmacokinetics and clinical endpoint timelines showing rapid receptor binding versus delayed A1c and weight loss outcomes.
This absorption profile means receptor binding begins within hours of the first dose. Biochemical presence is distinct from clinical outcome. The 2.5 mg starting dose serves as a tolerance induction phase rather than a therapeutic dose. The drug does not reach its full glucose-lowering capacity until patients titrate upward over several months.
Glycemic Endpoints: Week 4 Separation
Clinical trial data indicate that tirzepatide produces measurable reductions in A1c approximately four weeks after treatment initiation. Fay Nutrition cites this four-week benchmark for initial A1c lowering. Drugs.com reports that studies showed eight weeks to reach an A1c target of 7 percent or below and twelve weeks to reach 6.5 percent or below.
Sustained glycemic improvement continues beyond the early separation point. One study cited by Form Health found that by week 40, the average A1c dropped by 2.11 percentage points in patients taking the highest dose of tirzepatide. Peak glycemic effect may not arrive until week 40 of treatment, according to Medical News Today, though measurable benefit begins far earlier.
Weight Loss Velocity: 24 vs 72 Weeks
Weight reduction follows a more protracted course than glycemic control. Some patients report reduced appetite within days of the first injection, and Healthline notes that appetite suppression may begin within the first few weeks. Subjective hunger reduction is not the same endpoint as measured adipose tissue loss.
Clinical cohorts show meaningful weight loss accumulating over months. Form Health reports that by week 24, patients taking 10 mg and 15 mg doses lost close to 15 percent of starting body weight on average. The full effect extends further. Fay Nutrition cites study data showing 15 to 20 percent mean weight loss over 72 weeks.
The gap between the week-4 glycemic signal and the 72-week weight signal reflects the dose-response relationship built into the titration schedule. The 10 mg and 15 mg doses produce the largest weight reductions, but patients reach those doses only after several months of stepwise escalation.
Titration Constraints and Steady State
Dose escalation is the rate-limiting step for clinical onset. Tirzepatide starts at 2.5 mg weekly for four weeks, then increases in 2.5 mg increments every four weeks as tolerated, according to Drugs.com. The purpose is explicitly safety. Slower titration reduces the gastrointestinal adverse event profile associated with rapid dose increases.
The full therapeutic benefit of tirzepatide is not available during the first month of treatment by design. The starting dose exists to build tolerance rather than to produce maximum receptor occupancy. Patients who interpret the absence of dramatic early results as treatment failure risk discontinuing before reaching an effective dose.
GoodRx states that full glucose-lowering effects typically emerge between four and six months. This corresponds to when most patients have reached higher maintenance doses.
Evidence Limits and Interpretation
The timelines cited here derive from clinical study summaries and published drug profiles. They do not come from head-to-head randomized controlled trials comparing every dose arm across every endpoint. Individual variability in pharmacokinetics and pharmacodynamics is substantial. Some patients require higher doses before experiencing meaningful glycemic or weight effects. Lifestyle factors including caloric intake and physical activity modify the weight loss trajectory independently of drug exposure.
The FDA approved tirzepatide for type 2 diabetes management. The expanded cardiovascular indication now covers heart attack and stroke risk reduction in adults with type 2 diabetes at high cardiovascular risk. Weight loss is an observed effect in clinical cohorts but was not the original regulatory endpoint.
For readers tracking related incretin-based research, aleniglipron's phase 2b weight loss data illustrates how oral small-molecule GLP-1 candidates compare on efficacy timelines. Dual amylin calcitonin receptor agonists and cagrilintide pharmacology represent alternative peptide mechanisms under investigation. Readers seeking comparative context on fat-loss evidence for other peptide fragments may find the AOD 9604 clinical evidence summary useful, though that compound's evidence base is far thinner than the data supporting tirzepatide.
Tirzepatide's biochemical presence and its therapeutic efficacy operate on separate clocks. Receptor activation begins within hours. Glycemic separation appears by week four. Weight reduction accumulates over six to eighteen months. Patients and clinicians evaluating early treatment response should anchor expectations to these verified clinical milestones rather than to subjective appetite changes in the first week.